The TikZ and PGF Packages
Manual for version 3.1.9a
Graph Drawing
34 Graph Drawing Layouts: Phylogenetic Trees
by Sarah Mäusle and Till Tantau
Graph Drawing Library phylogenetics 
\usegdlibrary{phylogenetics} %
LaTeX
and plain
TeX
\usegdlibrary[phylogenetics] % ConTeXt
A phylogenetic tree (or network) depicts the evolutionary history of species or, more generally, so called taxa. The present library includes a number of algorithms for drawing phylogenetic trees.
/graph drawing/phylogenetic tree layout=⟨string⟩ 
Layout for drawing phylogenetic trees. ...
Example
                  \tikz \graph [phylogenetic tree layout, upgma,

                                distance matrix={

                                    0
                    4 9 9 9 9 9

                                    4
                    0 9 9 9 9 9

                                    9
                    9 0 2 7 7 7

                                    9
                    9 2 0 7 7 7

                                    9
                    9 7 7 0 3 5

                                    9
                    9 7 7 3 0 5

                                    9
                    9 7 7 5 5 0}]

                    { a, b, c, d, e, f, g
                  };
34.1 Generating a Phylogenetic Tree
...
When a phylogenetic tree is generated, new nodes and edges get created. In order to give you a chance at styling them, the following styles are executed:
/graph drawing/phylogenetic inner node(style, no value) 
The style is added every newly created inner node. In this manual, this key is set to:
/graph drawing/phylogenetic edge=⟨length⟩(style, no default) 
The style is added every newly created phylogenetic edge. The ⟨length⟩ will be set to the computed evolutionary length of the edge. In this manual, this key is set to:
                  \pgfgdset{phylogenetic
                  edge/.style={

                      /tikz/.cd, thick, rounded
                  corners

                    }

                  }
/graph drawing/phylogenetic tree by author=⟨string⟩ 
When this key is used, the phylogenetic tree must be specified by the author (rather than being generated algorithmically). A spanning tree of the input graph will be computed first (it must be connected, otherwise errors will result). The evolutionary length of the edges must be specified through the use of the length key for each edge.
Example
/graph drawing/unweighted pair group method using arithmetic averages=⟨string⟩ 
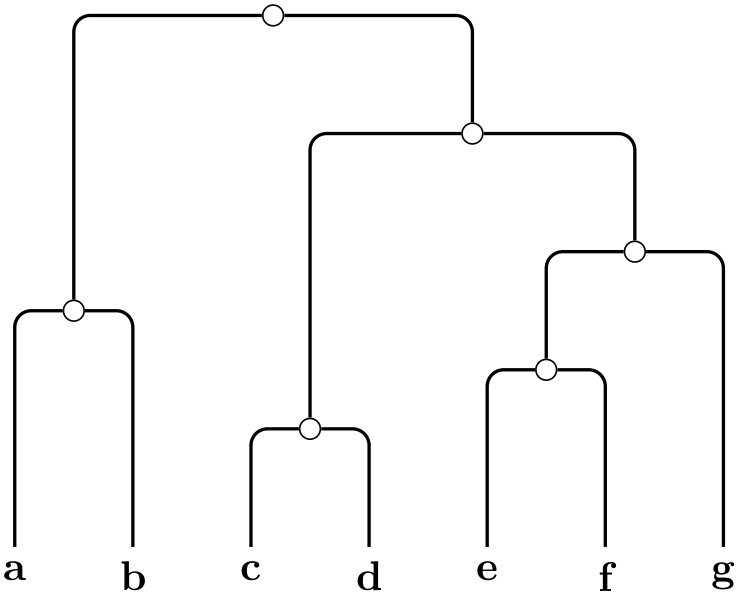
The UPGMA (Unweighted Pair Group Method using arithmetic Averages) algorithm of Sokal and Michener, 1958. It generates a graph on the basis of such a distance matrix by generating nodes and computing the edge lengths. This algorithm uses a distance matrix, ideally an ultrametric one, to compute the graph.
Example
                  \tikz \graph [phylogenetic tree layout, sibling distance=0pt, sibling sep=2pt,

                                unweighted pair group method using arithmetic averages,

                                distance matrix={

                                    0
                    4 9 9 9 9 9

                                    4
                    0 9 9 9 9 9

                                    9
                    9 0 2 7 7 7

                                    9
                    9 2 0 7 7 7

                                    9
                    9 7 7 0 3 5

                                    9
                    9 7 7 3 0 5

                                    9
                    9 7 7 5 5 0}]

                    { a, b, c, d, e, f, g
                  };
/graph drawing/upgma=⟨string⟩ 
An shorthand for unweighted pair group method using arithmetic averages
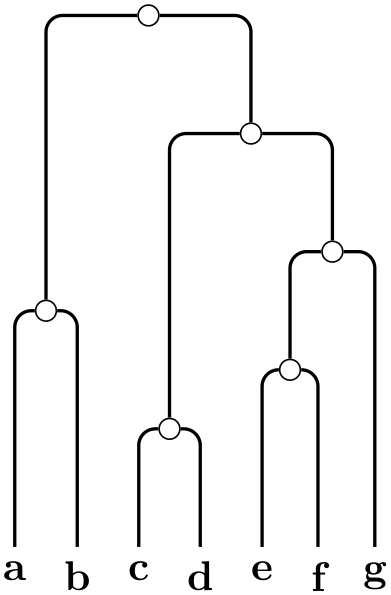
/graph drawing/balanced minimum evolution=⟨string⟩ 
The BME (Balanced Minimum Evolution) algorithm tries to minimize the total tree length. This algorithm is from Desper and Gascuel, Fast and Accurate Phylogeny Reconstruction Algorithms Based on the Minimum-Evolution Principle, 2002. The tree is built in a way that minimizes the total tree length. The leaves are inserted into the tree one after another, creating new edges and new nodes. After every insertion the distance matrix has to be updated.
Example
                  \tikz \graph [phylogenetic tree layout,

                                balanced minimum evolution,

                                grow'=right, sibling distance=0pt,

                                distance matrix={

                                    0
                    4 9 9 9 9 9

                                    4
                    0 9 9 9 9 9

                                    9
                    9 0 2 7 7 7

                                    9
                    9 2 0 7 7 7

                                    9
                    9 7 7 0 3 5

                                    9
                    9 7 7 3 0 5

                                    9
                    9 7 7 5 5 0}]

                    { a, b, c, d, e, f, g
                  };
/graph drawing/balanced nearest neighbour interchange=⟨string⟩ 
The BNNI (Balanced Nearest Neighbor Interchange) is a postprocessing algorithm for phylogenetic trees. It swaps two distant 3-subtrees if the total tree length is reduced by doing so, until no such swaps are left. This algorithm is from Desper and Gascuel, Fast and Accurate Phylogeny Reconstruction Algorithms Based on the Minimum-Evolution Principle, 2002.
/graph drawing/no phylogenetic tree optimization=⟨string⟩ 
Switches off any phylogenetic tree optimization.
34.2 Laying out the Phylogram
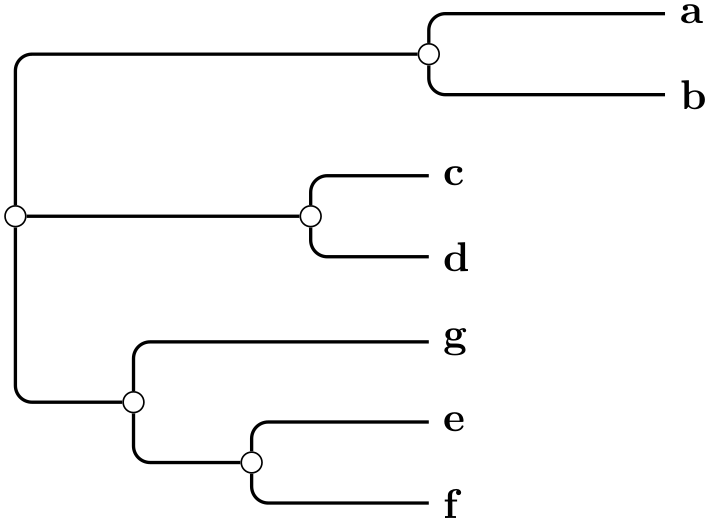
/graph drawing/rooted rectangular phylogram=⟨string⟩ 
A rooted rectangular phylogram is... ...
Example
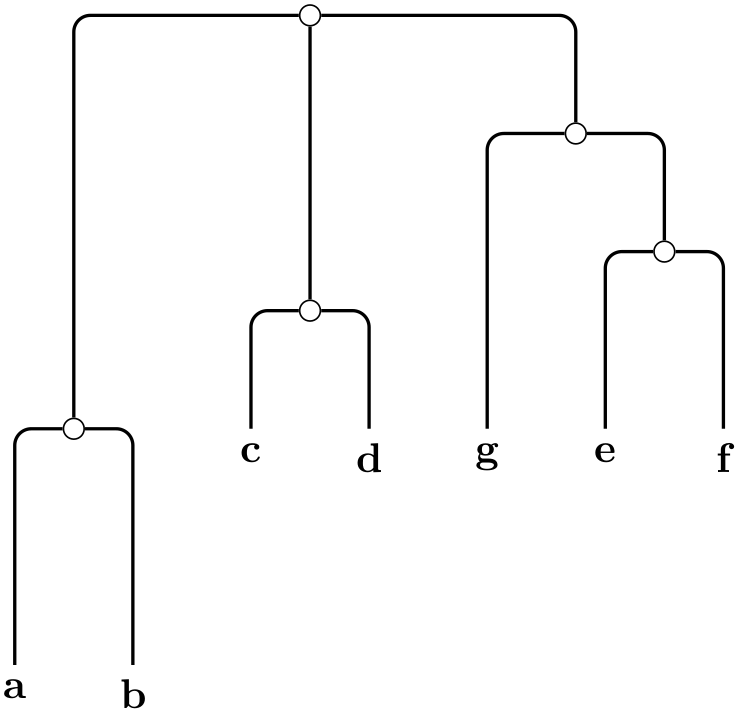
                  \tikz \graph [phylogenetic tree layout,

                                rooted rectangular phylogram,

                                balanced minimum evolution,

                                distance matrix={

                                    0
                    4 9 9 9 9 9

                                    4
                    0 9 9 9 9 9

                                    9
                    9 0 2 7 7 7

                                    9
                    9 2 0 7 7 7

                                    9
                    9 7 7 0 3 5

                                    9
                    9 7 7 3 0 5

                                    9
                    9 7 7 5 5 0}]

                    { a, b, c, d, e, f, g
                  };
/graph drawing/rectangular phylogram=⟨string⟩ 
An alias for rooted rectangular phylogram
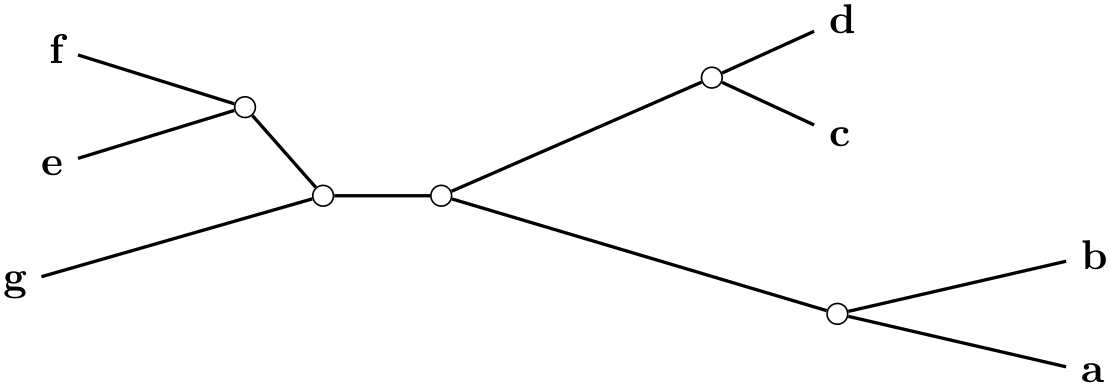
/graph drawing/rooted straight phylogram=⟨string⟩ 
A rooted straight phylogram is... ...
Example
                  \tikz \graph [phylogenetic tree layout,

                                rooted straight phylogram,

                                balanced minimum evolution, grow=right,

                                distance matrix={

                                    0
                    4 9 9 9 9 9

                                    4
                    0 9 9 9 9 9

                                    9
                    9 0 2 7 7 7

                                    9
                    9 2 0 7 7 7

                                    9
                    9 7 7 0 3 5

                                    9
                    9 7 7 3 0 5

                                    9
                    9 7 7 5 5 0}]

                    { a, b, c, d, e, f, g
                  };
/graph drawing/straight phylogram=⟨string⟩ 
An alias for rooted straight phylogram
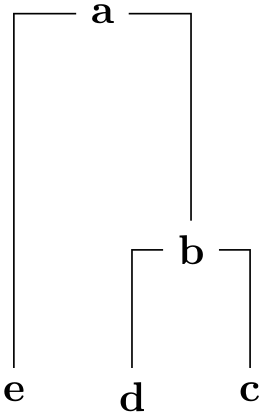
/graph drawing/unrooted rectangular phylogram=⟨string⟩ 
A unrooted rectangular phylogram is... ...
Example
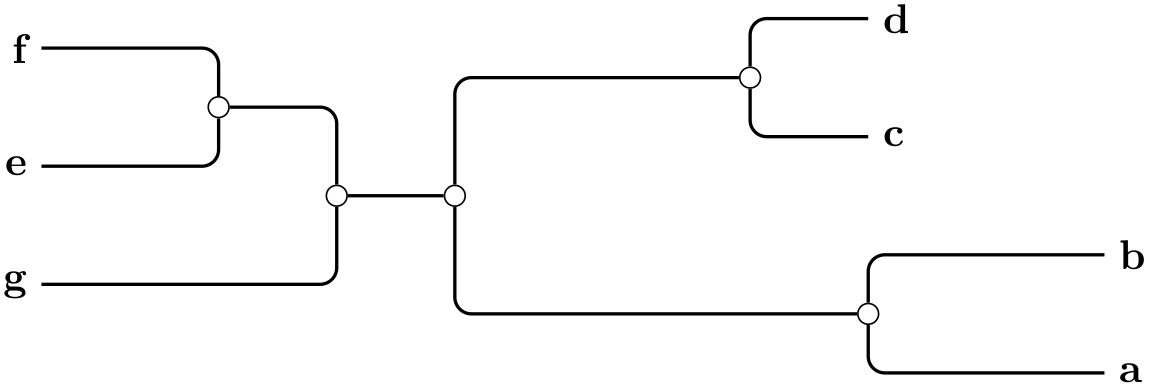
                  \tikz \graph [phylogenetic tree layout,

                                unrooted rectangular phylogram,

                                balanced minimum evolution, grow=right,

                                distance matrix={

                                    0
                    4 9 9 9 9 9

                                    4
                    0 9 9 9 9 9

                                    9
                    9 0 2 7 7 7

                                    9
                    9 2 0 7 7 7

                                    9
                    9 7 7 0 3 5

                                    9
                    9 7 7 3 0 5

                                    9
                    9 7 7 5 5 0}]

                    { a, b, c, d, e, f, g
                  };
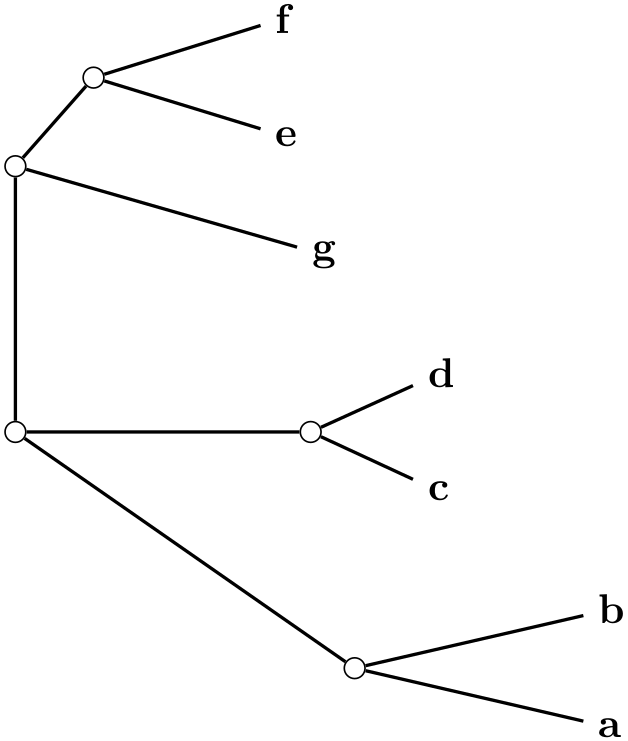
/graph drawing/unrooted straight phylogram=⟨string⟩ 
A unrooted straight phylogram is... ...
Example
                  \tikz \graph [phylogenetic tree layout,

                                unrooted straight phylogram,

                                balanced minimum evolution, grow=right,

                                distance matrix={

                                    0
                    4 9 9 9 9 9

                                    4
                    0 9 9 9 9 9

                                    9
                    9 0 2 7 7 7

                                    9
                    9 2 0 7 7 7

                                    9
                    9 7 7 0 3 5

                                    9
                    9 7 7 3 0 5

                                    9
                    9 7 7 5 5 0}]

                    { a, b, c, d, e, f, g
                  };
/graph drawing/evolutionary unit length=⟨length⟩ (initially 1cm) 
Specifies how long a “unit” of evolutionary time should be on paper. For instance, if two nodes in a phylogenetic tree have an evolutionary distance of 3 and this length is set to 1cm, then they will be 3cm apart in a straight-line phylogram. (This key used to be called distance scaling factor.)