The TikZ and PGF Packages
Manual for version 3.1.9a
Libraries
65 Plot Handler Library
TikZ Library plothandlers 
\usepgflibrary{plothandlers} %
LaTeX
and plain
TeX
and pure pgf
\usepgflibrary[plothandlers] % ConTeXt and pure pgf
\usetikzlibrary{plothandlers} %
LaTeX
and plain
TeX
when using TikZ
\usetikzlibrary[plothandlers] % ConTeXt when using TikZ
This library packages defines additional plot handlers, see
Section 111.3
for an introduction to plot handlers. The additional handlers are
described in the following.
This library is loaded automatically by TikZ.
65.1 Curve Plot Handlers
\pgfplothandlercurveto 
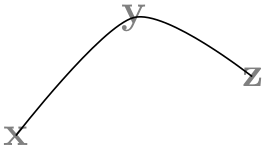
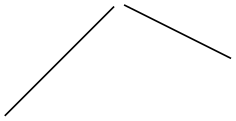
This handler will issue a \pgfpathcurveto command for each point of the plot, except possibly for the first. As for the line-to handler, what happens with the first point can be specified using \pgfsetmovetofirstplotpoint or \pgfsetlinetofirstplotpoint.
Obviously, the \pgfpathcurveto command needs, in addition to the points on the path, some control points. These are generated automatically using a somewhat “dumb” algorithm: Suppose you have three points \(x\), \(y\), and \(z\) on the curve such that \(y\) is between \(x\) and \(z\):
                  \begin{tikzpicture}

                    \draw[gray] (0,0) node
                  {x} (1,1) node
                  {y} (2,.5) node
                  {z};

                    \pgfplothandlercurveto

                    \pgfplotstreamstart

                    \pgfplotstreampoint{\pgfpoint{0cm}{0cm}}

                    \pgfplotstreampoint{\pgfpoint{1cm}{1cm}}

                    \pgfplotstreampoint{\pgfpoint{2cm}{.5cm}}

                    \pgfplotstreamend

                    \pgfusepath{stroke}

                  \end{tikzpicture}
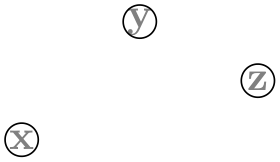
In order to determine the control points of the curve at the point \(y\), the handler computes the vector \(z-x\) and scales it by the tension factor (see below). Let us call the resulting vector \(s\). Then \(y+s\) and \(y-s\) will be the control points around \(y\). The first control point at the beginning of the curve will be the beginning itself, once more; likewise the last control point is the end itself.
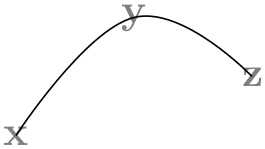
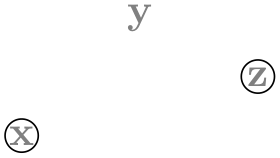
\pgfsetplottension{⟨value⟩} 
Sets the factor used by the curve plot handlers to determine the distance of the control points from the points they control. The higher the curvature of the curve points, the higher this value should be. A value of \(1\) will cause four points at quarter positions of a circle to be connected using a circle. The default is \(0.5\).
                  \begin{tikzpicture}

                    \draw[gray] (0,0) node
                  {x} (1,1) node
                  {y} (2,.5) node
                  {z};

                    \pgfsetplottension{0.75}

                    \pgfplothandlercurveto

                    \pgfplotstreamstart

                    \pgfplotstreampoint{\pgfpoint{0cm}{0cm}}

                    \pgfplotstreampoint{\pgfpoint{1cm}{1cm}}

                    \pgfplotstreampoint{\pgfpoint{2cm}{0.5cm}}

                    \pgfplotstreamend

                    \pgfusepath{stroke}

                  \end{tikzpicture}
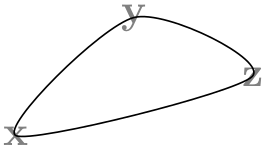
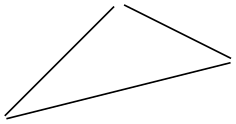
\pgfplothandlerclosedcurve 
This handler works like the curve-to plot handler, only it will add a new part to the current path that is a closed curve through the plot points.
                  \begin{tikzpicture}

                    \draw[gray] (0,0) node
                  {x} (1,1) node
                  {y} (2,.5) node
                  {z};

                    \pgfplothandlerclosedcurve

                    \pgfplotstreamstart

                    \pgfplotstreampoint{\pgfpoint{0cm}{0cm}}

                    \pgfplotstreampoint{\pgfpoint{1cm}{1cm}}

                    \pgfplotstreampoint{\pgfpoint{2cm}{0.5cm}}

                    \pgfplotstreamend

                    \pgfusepath{stroke}

                  \end{tikzpicture}
65.2 Constant Plot Handlers
There are several plot handlers which produce piecewise constant interpolations between successive points:
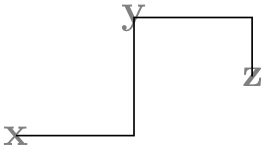
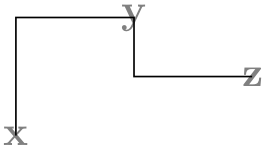
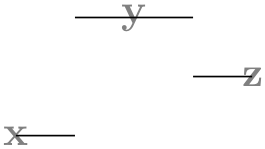
\pgfplothandlerconstantlineto 
This handler works like the line-to plot handler, only it will produce a connected, piecewise constant path to connect the points.
                  \begin{tikzpicture}

                    \draw[gray] (0,0) node
                  {x} (1,1) node
                  {y} (2,.5) node
                  {z};

                    \pgfplothandlerconstantlineto

                    \pgfplotstreamstart

                    \pgfplotstreampoint{\pgfpoint{0cm}{0cm}}

                    \pgfplotstreampoint{\pgfpoint{1cm}{1cm}}

                    \pgfplotstreampoint{\pgfpoint{2cm}{0.5cm}}

                    \pgfplotstreamend

                    \pgfusepath{stroke}

                  \end{tikzpicture}
\pgfplothandlerconstantlinetomarkright 
A variant of \pgfplothandlerconstantlineto which places its mark on the right line ends.
                  \begin{tikzpicture}

                    \draw[gray] (0,0) node
                  {x} (1,1) node
                  {y} (2,.5) node
                  {z};

                    \pgfplothandlerconstantlinetomarkright

                    \pgfplotstreamstart

                    \pgfplotstreampoint{\pgfpoint{0cm}{0cm}}

                    \pgfplotstreampoint{\pgfpoint{1cm}{1cm}}

                    \pgfplotstreampoint{\pgfpoint{2cm}{0.5cm}}

                    \pgfplotstreamend

                    \pgfusepath{stroke}

                  \end{tikzpicture}
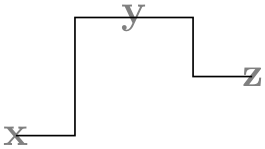
\pgfplothandlerconstantlinetomarkmid 
A variant of \pgfplothandlerconstantlineto which places its mark on the center of the line.
                  \begin{tikzpicture}

                    \draw[gray] (0,0) node
                  {x} (1,1) node
                  {y} (2,.5) node
                  {z};

                    \pgfplothandlerconstantlinetomarkmid

                    \pgfplotstreamstart

                    \pgfplotstreampoint{\pgfpoint{0cm}{0cm}}

                    \pgfplotstreampoint{\pgfpoint{1cm}{1cm}}

                    \pgfplotstreampoint{\pgfpoint{2cm}{0.5cm}}

                    \pgfplotstreamend

                    \pgfusepath{stroke}

                  \end{tikzpicture}
The plot handler always connects two data points by a horizontal line starting from the previous data points, followed by a vertical line in the middle between the two data points, followed by a horizontal line between the middle and the current data point. This results in a symmetric constant plot handler for constant mesh width.
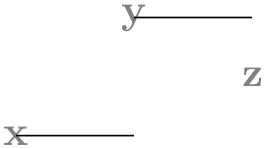
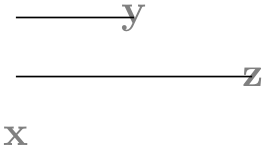
\pgfplothandlerjumpmarkleft 
This handler works like the line-to plot handler, only it will produce a non-connected, piecewise constant path to connect the points. If there are any plot marks, they will be placed on the left open pieces.
                  \begin{tikzpicture}

                    \draw[gray] (0,0) node
                  {x} (1,1) node
                  {y} (2,.5) node
                  {z};

                    \pgfplothandlerjumpmarkleft

                    \pgfplotstreamstart

                    \pgfplotstreampoint{\pgfpoint{0cm}{0cm}}

                    \pgfplotstreampoint{\pgfpoint{1cm}{1cm}}

                    \pgfplotstreampoint{\pgfpoint{2cm}{0.5cm}}

                    \pgfplotstreamend

                    \pgfusepath{stroke}

                  \end{tikzpicture}
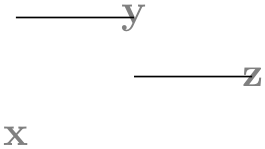
\pgfplothandlerjumpmarkright 
This handler works like the line-to plot handler, only it will produce a non-connected, piecewise constant path to connect the points. If there are any plot marks, they will be placed on the right open pieces.
                  \begin{tikzpicture}

                    \draw[gray] (0,0) node
                  {x} (1,1) node
                  {y} (2,.5) node
                  {z};

                    \pgfplothandlerjumpmarkright

                    \pgfplotstreamstart

                    \pgfplotstreampoint{\pgfpoint{0cm}{0cm}}

                    \pgfplotstreampoint{\pgfpoint{1cm}{1cm}}

                    \pgfplotstreampoint{\pgfpoint{2cm}{0.5cm}}

                    \pgfplotstreamend

                    \pgfusepath{stroke}

                  \end{tikzpicture}
\pgfplothandlerjumpmarkmid 
This handler works like the \pgfplothandlerconstantlinetomarkmid, but it will produce a non-connected, piecewise constant path to connect the points. If there are any plot marks, they will be placed in the center of the horizontal line segment..
                  \begin{tikzpicture}

                    \draw[gray] (0,0) node
                  {x} (1,1) node
                  {y} (2,.5) node
                  {z};

                    \pgfplothandlerjumpmarkmid

                    \pgfplotstreamstart

                    \pgfplotstreampoint{\pgfpoint{0cm}{0cm}}

                    \pgfplotstreampoint{\pgfpoint{1cm}{1cm}}

                    \pgfplotstreampoint{\pgfpoint{2cm}{0.5cm}}

                    \pgfplotstreamend

                    \pgfusepath{stroke}

                  \end{tikzpicture}
See \pgfplothandlerconstantlinetomarkmid for details.
65.3 Comb Plot Handlers
There are three “comb” plot handlers. Their name stems from the fact that the plots they produce look like “combs” (more or less).
\pgfplothandlerxcomb 
This handler converts each point in the plot stream into a line from the \(y\)-axis to the point’s coordinate, resulting in a “horizontal comb”.
                  \begin{tikzpicture}

                    \draw[gray] (0,0) node
                  {x} (1,1) node
                  {y} (2,.5) node
                  {z};

                    \pgfplothandlerxcomb

                    \pgfplotstreamstart

                    \pgfplotstreampoint{\pgfpoint{0cm}{0cm}}

                    \pgfplotstreampoint{\pgfpoint{1cm}{1cm}}

                    \pgfplotstreampoint{\pgfpoint{2cm}{0.5cm}}

                    \pgfplotstreamend

                    \pgfusepath{stroke}

                  \end{tikzpicture}
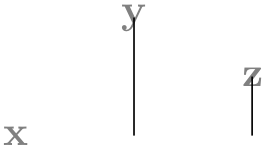
\pgfplothandlerycomb 
This handler converts each point in the plot stream into a line from the \(x\)-axis to the point’s coordinate, resulting in a “vertical comb”.
This handler is useful for creating “bar diagrams”.
                  \begin{tikzpicture}

                    \draw[gray] (0,0) node
                  {x} (1,1) node
                  {y} (2,.5) node
                  {z};

                    \pgfplothandlerycomb

                    \pgfplotstreamstart

                    \pgfplotstreampoint{\pgfpoint{0cm}{0cm}}

                    \pgfplotstreampoint{\pgfpoint{1cm}{1cm}}

                    \pgfplotstreampoint{\pgfpoint{2cm}{0.5cm}}

                    \pgfplotstreamend

                    \pgfusepath{stroke}

                  \end{tikzpicture}
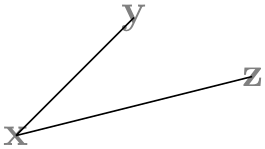
\pgfplothandlerpolarcomb 
This handler converts each point in the plot stream into a line from the origin to the point’s coordinate.
                  \begin{tikzpicture}

                    \draw[gray] (0,0) node
                  {x} (1,1) node
                  {y} (2,.5) node
                  {z};

                    \pgfplothandlerpolarcomb

                    \pgfplotstreamstart

                    \pgfplotstreampoint{\pgfpoint{0cm}{0cm}}

                    \pgfplotstreampoint{\pgfpoint{1cm}{1cm}}

                    \pgfplotstreampoint{\pgfpoint{2cm}{0.5cm}}

                    \pgfplotstreamend

                    \pgfusepath{stroke}

                  \end{tikzpicture}
pgf bar or comb plots usually draw something from zero to the current plot’s coordinate. The “zero” offset can be changed using an input stream which returns the desired offset successively for each processed coordinate.
There are two such streams, which can be configured independently. The first one returns “zeros” for coordinate \(x\), the second one returns “zeros” for coordinate \(y\). They are used as follows.
                \pgfplotxzerolevelstreamstart

                \pgfplotxzerolevelstreamnext % assigns \pgf@x

                \pgfplotxzerolevelstreamnext

                \pgfplotxzerolevelstreamnext

                \pgfplotxzerolevelstreamend
                \pgfplotyzerolevelstreamstart

                \pgfplotyzerolevelstreamnext % assigns \pgf@x

                \pgfplotyzerolevelstreamend
Different zero level streams can be implemented by overwriting these macros.
\pgfplotxzerolevelstreamconstant{⟨dimension⟩} 
This zero level stream always returns {⟨dimension⟩} instead of \(x=0\)pt.
It is used for xcomb and xbar.
\pgfplotyzerolevelstreamconstant{⟨dimension⟩} 
This zero level stream always returns {⟨dimension⟩} instead of \(y=0\)pt.
It is used for ycomb and ybar.
65.4 Bar Plot Handlers
While comb plot handlers produce a line-to operation to generate combs, bar plot handlers employ rectangular shapes, allowing filled bars (or pattern bars).
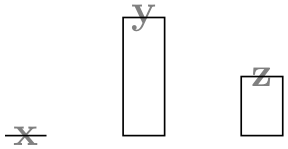
\pgfplothandlerybar 
This handler converts each point in the plot stream into a rectangle from the \(x\)-axis to the point’s coordinate. The rectangle is placed centered at the \(x\)-axis.
                  \begin{tikzpicture}

                    \draw[gray] (0,0) node
                  {x} (1,1) node
                  {y} (2,.5) node
                  {z};

                    \pgfplothandlerybar

                    \pgfplotstreamstart

                    \pgfplotstreampoint{\pgfpoint{0cm}{0cm}}

                    \pgfplotstreampoint{\pgfpoint{1cm}{1cm}}

                    \pgfplotstreampoint{\pgfpoint{2cm}{0.5cm}}

                    \pgfplotstreamend

                    \pgfusepath{stroke}

                  \end{tikzpicture}
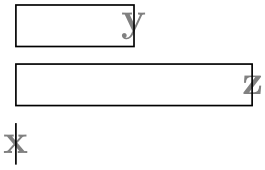
\pgfplothandlerxbar 
This handler converts each point in the plot stream into a rectangle from the \(y\)-axis to the point’s coordinate. The rectangle is placed centered at the \(y\)-axis.
                  \begin{tikzpicture}

                    \draw[gray] (0,0) node
                  {x} (1,1) node
                  {y} (2,.5) node
                  {z};

                    \pgfplothandlerxbar

                    \pgfplotstreamstart

                    \pgfplotstreampoint{\pgfpoint{0cm}{0cm}}

                    \pgfplotstreampoint{\pgfpoint{1cm}{1cm}}

                    \pgfplotstreampoint{\pgfpoint{2cm}{0.5cm}}

                    \pgfplotstreamend

                    \pgfusepath{stroke}

                  \end{tikzpicture}
/pgf/bar width={⟨dimension⟩} (no default, initially 10pt) 
alias /tikz/bar width
Sets the width of \pgfplothandlerxbar and \pgfplothandlerybar to {⟨dimension⟩}. The argument {⟨dimension⟩} will be evaluated using the math parser.
/pgf/bar shift={⟨dimension⟩} (no default, initially 0pt) 
alias /tikz/bar shift
Sets a shift used by \pgfplothandlerxbar and \pgfplothandlerybar to {⟨dimension⟩}. It has the same effect as xshift, but it applies only to those bar plots. The argument {⟨dimension⟩} will be evaluated using the math parser.
\pgfplotbarwidth 
Expands to the value of /pgf/bar width.
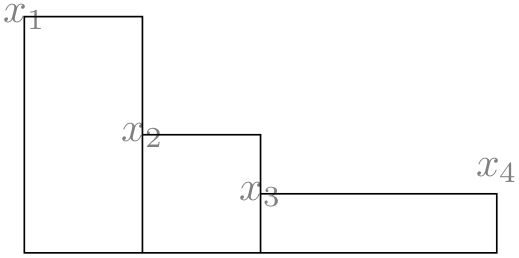
\pgfplothandlerybarinterval 
This handler is a variant of \pgfplothandlerybar which works with intervals instead of points.
Bars are drawn between successive input coordinates and the width is determined relatively to the interval length.
                  \begin{tikzpicture}

                    \draw[gray] (0,2) node
                  {$x_1$} (1,1) node
                  {$x_2$} (2,.5) node
                  {$x_3$} (4,0.7) node
                  {$x_4$};

                    \pgfplothandlerybarinterval

                    \pgfplotstreamstart

                    \pgfplotstreampoint{\pgfpoint{0cm}{2cm}}

                    \pgfplotstreampoint{\pgfpoint{1cm}{1cm}}

                    \pgfplotstreampoint{\pgfpoint{2cm}{0.5cm}}

                    \pgfplotstreampoint{\pgfpoint{4cm}{0.7cm}}

                    \pgfplotstreamend

                    \pgfusepath{stroke}

                  \end{tikzpicture}
In more detail, if \((x_i,y_i)\) and \((x_{i+1},y_{i+1})\) denote successive input coordinates, the bar will be placed above the interval \([x_i,x_{i+1}]\), centered at
\[ x_i + \text {\meta {bar interval shift}} \cdot (x_{i+1} - x_i) \]
with width
\[ \text {\meta {bar interval width}} \cdot (x_{i+1} - x_i). \]
Here, ⟨bar interval shift⟩ and ⟨bar interval width⟩ denote the current values of the associated options.
If you have \(N+1\) input points, you will get \(N\) bars (one for each interval). The \(y\) value of the last point will be ignored.
\pgfplothandlerxbarinterval 
As \pgfplothandlerybarinterval, this handler provides bar plots with relative bar sizes and offsets, one bar for each \(y\) coordinate interval.
/pgf/bar interval shift={⟨factor⟩} (no default, initially 0.5) 
alias /tikz/bar interval shift
Sets the relative shift of \pgfplothandlerxbarinterval and \pgfplothandlerybarinterval to ⟨factor⟩. As /pgf/bar interval width, the argument is relative to the interval length of the input coordinates.
The argument {⟨scale⟩} will be evaluated using the math parser.
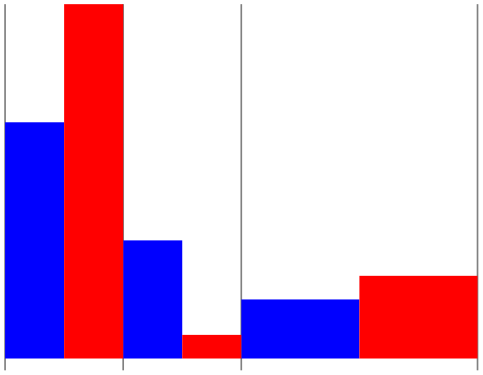
/pgf/bar interval width={⟨scale⟩} (no default, initially 1) 
alias /tikz/bar interval width
Sets the relative width of \pgfplothandlerxbarinterval and \pgfplothandlerybarinterval to {⟨scale⟩}. The argument is relative to \((x_{i+1} - x_i)\) for \(y\) bar plots and relative to \((y_{i+1}-y_i)\) for \(x\) bar plots.
The argument {⟨scale⟩} will be evaluated using the math parser.
                  \begin{tikzpicture}[bar interval width=0.5]

                    \draw[gray]

                      (0,3) --
                  (0,-0.1)

                      (1,3) --
                  (1,-0.1)

                      (2,3) --
                  (2,-0.1)

                      (4,3) --
                  (4,-0.1);

                    \pgfplothandlerybarinterval

                    \begin{scope}[bar interval shift=0.25,fill=blue]

                    \pgfplotstreamstart

                    \pgfplotstreampoint{\pgfpoint{0cm}{2cm}}

                    \pgfplotstreampoint{\pgfpoint{1cm}{1cm}}

                    \pgfplotstreampoint{\pgfpoint{2cm}{0.5cm}}

                    \pgfplotstreampoint{\pgfpoint{4cm}{0.7cm}}

                    \pgfplotstreamend

                    \pgfusepath{fill}

                    \end{scope}

                    \begin{scope}[bar interval shift=0.75,fill=red]

                    \pgfplotstreamstart

                    \pgfplotstreampoint{\pgfpoint{0cm}{3cm}}

                    \pgfplotstreampoint{\pgfpoint{1cm}{0.2cm}}

                    \pgfplotstreampoint{\pgfpoint{2cm}{0.7cm}}

                    \pgfplotstreampoint{\pgfpoint{4cm}{0.2cm}}

                    \pgfplotstreamend

                    \pgfusepath{fill}

                    \end{scope}

                  \end{tikzpicture}
Please note that bars are always centered, so we have to use shifts \(0.25\) and \(0.75\) instead of \(0\) and \(0.5\).
65.5 Gapped Plot Handlers
\pgfplothandlergaplineto 
This handler will connect the points of the plots by straight line segments. However, at the start and the end of the lines there will be a small gap, given by the following key:
/pgf/gap around stream point=⟨dimension⟩ (no default, initially 1.5pt) 
The ⟨dimension⟩ by which the lines between consecutive stream points are shortened at the beginning and end.
                  \begin{tikzpicture}

                    \pgfplothandlergaplineto

                    \pgfplotstreamstart

                    \pgfplotstreampoint{\pgfpoint{0cm}{0cm}}

                    \pgfplotstreampoint{\pgfpoint{1cm}{1cm}}

                    \pgfplotstreampoint{\pgfpoint{2cm}{0.5cm}}

                    \pgfplotstreamend

                    \pgfusepath{stroke}

                  \end{tikzpicture}
\pgfplothandlergapcycle 
Works like \pgfplothandlergaplineto, but the last point is connected to the first in the same fashion:
                  \begin{tikzpicture}

                    \pgfplothandlergapcycle

                    \pgfplotstreamstart

                    \pgfplotstreampoint{\pgfpoint{0cm}{0cm}}

                    \pgfplotstreampoint{\pgfpoint{1cm}{1cm}}

                    \pgfplotstreampoint{\pgfpoint{2cm}{0.5cm}}

                    \pgfplotstreamend

                    \pgfusepath{stroke}

                  \end{tikzpicture}
65.6 Mark Plot Handler
\pgfplothandlermark{⟨mark code⟩} 
This command will execute the ⟨mark code⟩ for some points of the plot, but each time the coordinate transformation matrix will be set up such that the origin is at the position of the point to be plotted. This way, if the ⟨mark code⟩ draws a little circle around the origin, little circles will be drawn at some point of the plot.
By default, a mark is drawn at all points of the plot. However, two parameters \(r\) and \(p\) influence this. First, only every \(r\)th mark is drawn. Second, the first mark drawn is the \(p\)th. These parameters can be influenced using the commands below.
                  \begin{tikzpicture}

                    \draw[gray] (0,0) node
                  {x} (1,1) node
                  {y} (2,.5) node
                  {z};

                    \pgfplothandlermark{\pgfpathcircle{\pgfpointorigin}{4pt}\pgfusepath{stroke}}

                    \pgfplotstreamstart

                    \pgfplotstreampoint{\pgfpoint{0cm}{0cm}}

                    \pgfplotstreampoint{\pgfpoint{1cm}{1cm}}

                    \pgfplotstreampoint{\pgfpoint{2cm}{0.5cm}}

                    \pgfplotstreamend

                    \pgfusepath{stroke}

                  \end{tikzpicture}
Typically, the ⟨code⟩ will be \pgfuseplotmark{⟨plot mark name⟩}, where ⟨plot mark name⟩ is the name of a predefined plot mark.
\pgfsetplotmarkrepeat{⟨repeat⟩} 
Sets the \(r\) parameter to ⟨repeat⟩, that is, only every \(r\)th mark will be drawn.
\pgfsetplotmarkphase{⟨phase⟩} 
Sets the \(p\) parameter to ⟨phase⟩, that is, the first mark to be drawn is the \(p\)th, followed by the \((p+r)\)th, then the \((p+2r)\)th, and so on.
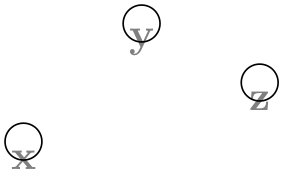
\pgfplothandlermarklisted{⟨mark code⟩}{⟨index list⟩} 
This command works similar to the previous one. However, marks will only be placed at those indices in the given ⟨index list⟩. The syntax for the list is the same as for the \foreach statement. For example, if you provide the list 1,3,...,25, a mark will be placed only at every second point. Similarly, 1,2,4,8,16,32 yields marks only at those points that are powers of two.
                  \begin{tikzpicture}

                    \draw[gray] (0,0) node
                  {x} (1,1) node
                  {y} (2,.5) node
                  {z};

                    \pgfplothandlermarklisted

                      {\pgfpathcircle{\pgfpointorigin}{4pt}\pgfusepath{stroke}}

                      {1,3}

                    \pgfplotstreamstart

                    \pgfplotstreampoint{\pgfpoint{0cm}{0cm}}

                    \pgfplotstreampoint{\pgfpoint{1cm}{1cm}}

                    \pgfplotstreampoint{\pgfpoint{2cm}{0.5cm}}

                    \pgfplotstreamend

                    \pgfusepath{stroke}

                  \end{tikzpicture}
\pgfuseplotmark{⟨plot mark name⟩} 
Draws the given ⟨plot mark name⟩ at the origin. The ⟨plot mark name⟩ must have been previously declared using \pgfdeclareplotmark.
\begin{tikzpicture}
\draw[gray] (0,0) node
{x} (1,1) node
{y} (2,.5) node
{z};
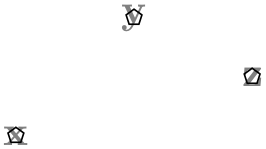
\pgfplothandlermark{\pgfuseplotmark{pentagon}}
\pgfplotstreamstart
\pgfplotstreampoint{\pgfpoint{0cm}{0cm}}
\pgfplotstreampoint{\pgfpoint{1cm}{1cm}}
\pgfplotstreampoint{\pgfpoint{2cm}{0.5cm}}
\pgfplotstreamend
\pgfusepath{stroke}
\end{tikzpicture}
\pgfdeclareplotmark{⟨plot mark name⟩}{⟨code⟩} 
Declares a plot mark for later used with the \pgfuseplotmark command.
                  \pgfdeclareplotmark{my
                  plot
                  mark}

                    {\pgfpathcircle{\pgfpoint{0cm}{1ex}}{1ex}\pgfusepathqstroke}

                  \begin{tikzpicture}

                    \draw[gray] (0,0) node
                  {x} (1,1) node
                  {y} (2,.5) node
                  {z};

                    \pgfplothandlermark{\pgfuseplotmark{my
                  plot
                  mark}}

                    \pgfplotstreamstart

                    \pgfplotstreampoint{\pgfpoint{0cm}{0cm}}

                    \pgfplotstreampoint{\pgfpoint{1cm}{1cm}}

                    \pgfplotstreampoint{\pgfpoint{2cm}{0.5cm}}

                    \pgfplotstreamend

                    \pgfusepath{stroke}

                  \end{tikzpicture}
\pgfsetplotmarksize{⟨dimension⟩} 
This command sets the TeX dimension \pgfplotmarksize to ⟨dimension⟩. This dimension is a “recommendation” for plot mark code at which size the plot mark should be drawn; plot mark code may choose to ignore this ⟨dimension⟩ altogether. For circles, ⟨dimension⟩ should be the radius, for other shapes it should be about half the width/height.
The predefined plot marks all take this dimension into account.

                  \begin{tikzpicture}

                    \draw[gray] (0,0) node
                  {x} (1,1) node
                  {y} (2,.5) node
                  {z};

                    \pgfsetplotmarksize{1ex}

                    \pgfplothandlermark{\pgfuseplotmark{*}}

                    \pgfplotstreamstart

                    \pgfplotstreampoint{\pgfpoint{0cm}{0cm}}

                    \pgfplotstreampoint{\pgfpoint{1cm}{1cm}}

                    \pgfplotstreampoint{\pgfpoint{2cm}{0.5cm}}

                    \pgfplotstreamend

                    \pgfusepath{stroke}

                  \end{tikzpicture}
\pgfplotmarksize 
A TeX dimension that is a “recommendation” for the size of plot marks.
The following plot marks are predefined (the filling color has been set to yellow):
| \pgfuseplotmark{*} |

|
| \pgfuseplotmark{x} |

|
| \pgfuseplotmark{+} |

|